energyPRO 5.0
New generation of energyPRO
Explore energyPRO 5.0, now featuring a completely redesigned user interface with a modern, streamlined look. Enjoy an intuitive workflow with enhanced ribbons, clear overviews, and updated icons and colors for a more seamless experience.
“Excited to share my first experience with energyPRO 5.0
– and wow, it’s fantastic! The new features are incredible, and the visual updates make it a joy to use. Kudos to the team behind this amazing tool!”
Industrial Phd. Toke Christensen, Aalborg Forsyning
Click here to download
Ribbons
We have made the workflow more intuitive by using ribbons. The Project Setup ribbon allows you to define the module, calculation period, currency, and other settings. The Calculation Setup ribbon lets you configure solver settings, calculation steps, optimization period, warnings, and more.
Additionally, report selection has been moved to its own ribbon for easier access.
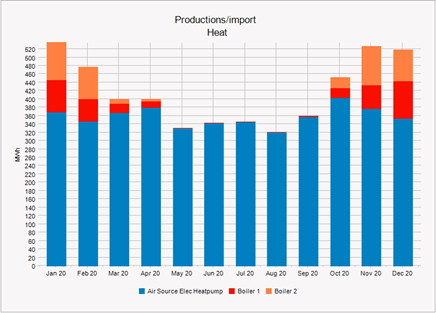
Pie and bar charts
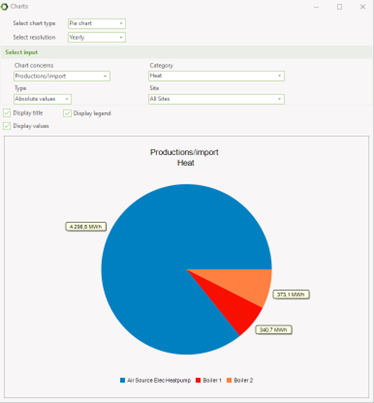
We introduce a new pie and bar charts that allow you to display monthly or annual values in either format.
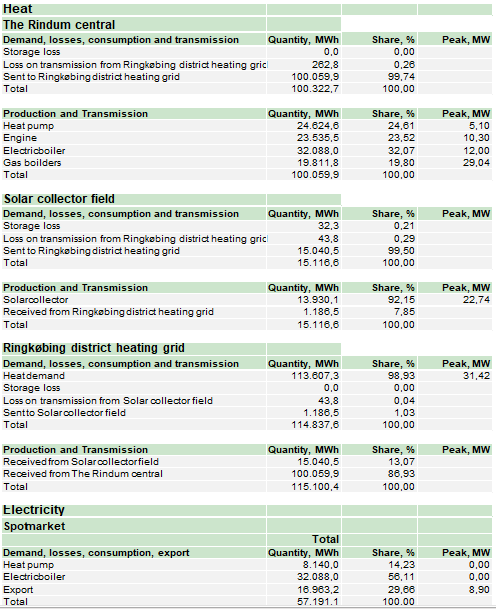
New layout of text reports
We have given the energy conversion and economy reports an overhaul, making them more visually appealing.
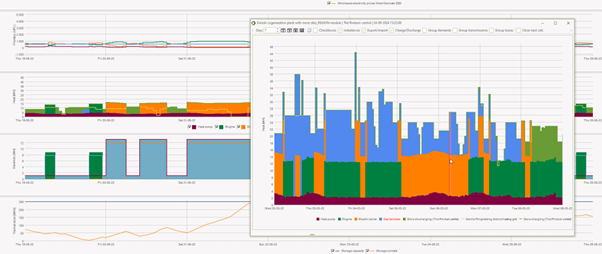
Improved Production, graphic
The curves in the production graph are now stacked, allowing you to visualize storage charging/discharging and market import/export. You can choose to display demands, transmissions, and losses either individually or grouped. If there is an imbalance in the model, it can be visualized to identify where the issue is occurring. Additionally, checkboxes can be enabled to easily display only the values you’re interested in.
You can also right-click on a graph and select the option to display it in a separate window.
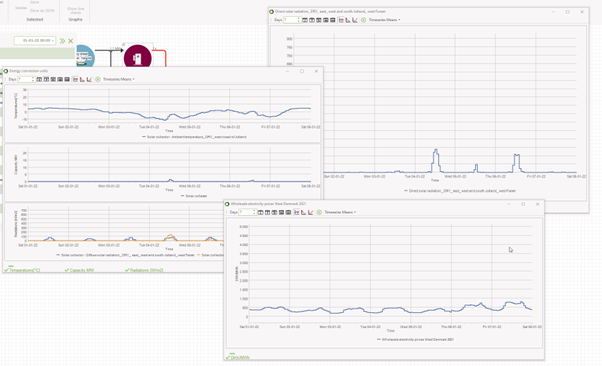
Multiple graphs open simultaneously
Another useful feature is the ability to have multiple graph windows open at once, allowing for easier comparison and analysis.
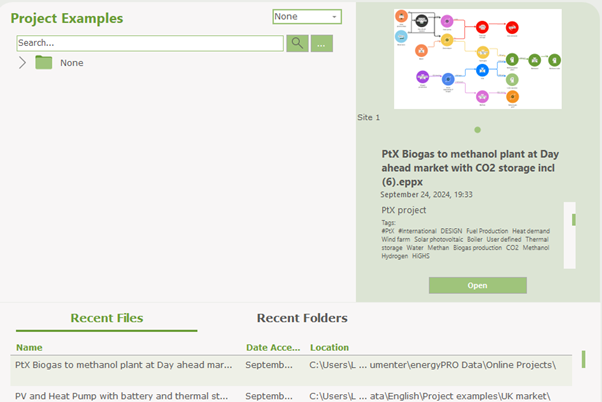
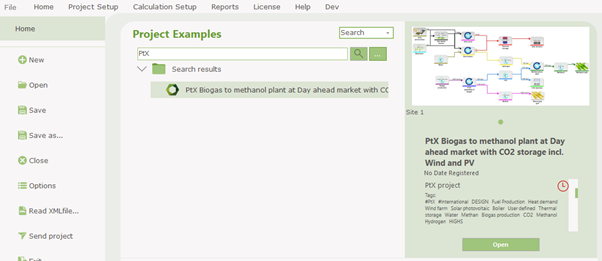
All online project examples come with tags and metadata.
In the File ribbon, you can search for specific tags or metadata to quickly find the relevant projects.
Online Help
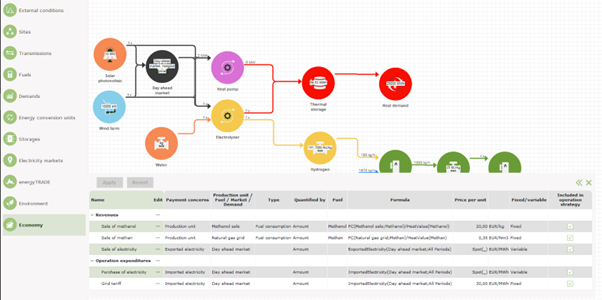
Left side menu with overviews
The input data window from energyPRO 4.9 has been replaced by a new “Left Side Menu with Overviews.”
Each item in the left side menu provides an overview that you can open, making it easier to review payments, time series, demands, energy conversion units, and more.
These overviews are also editable, so in many cases, you will not need to access the specific component directly.
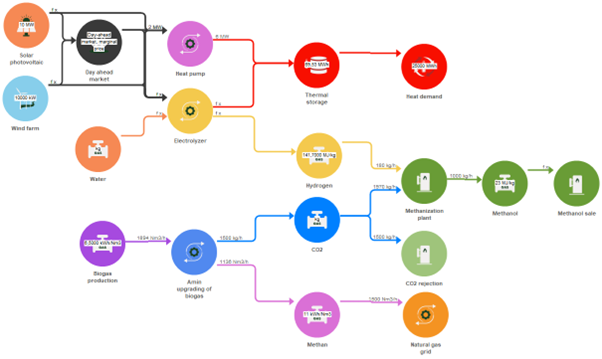
Graphical user interface
The graphical user interface has been enhanced with updated color palettes, shapes, and icons.
You can choose between circular and square shapes, as well as between a green palette or a more vibrant, colorful option. Additionally, the line width and corner styles connecting the objects are customizable.
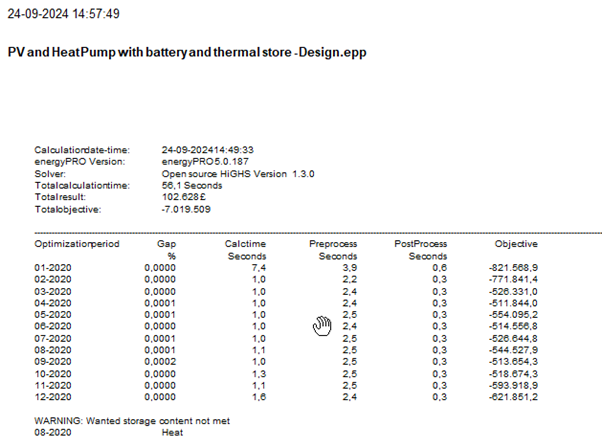
Calculation log report
Another new report is the Calculation Log Report, which provides detailed information on the solver, calculation time for each optimization period, warnings, and more.
Updated structure of energy conversion annual report
The structure of the Energy Conversion Annual Report has been updated for greater consistency.
It is now organized first by energy type, then by site, and finally by demand/consumption and production/import.
Statistic on time series graphs
We have added statistical information to the time series and demand graphs.
You can now view minimum, maximum, and mean values, both for monthly and annual curves, as well as diurnal means
Projects and time series online
With energyPRO 5.0, you have access to project examples and various time series online.
energyPRO 5.0 project files are saved in a new format, .eppx. This new format enables setting tags and meta data.
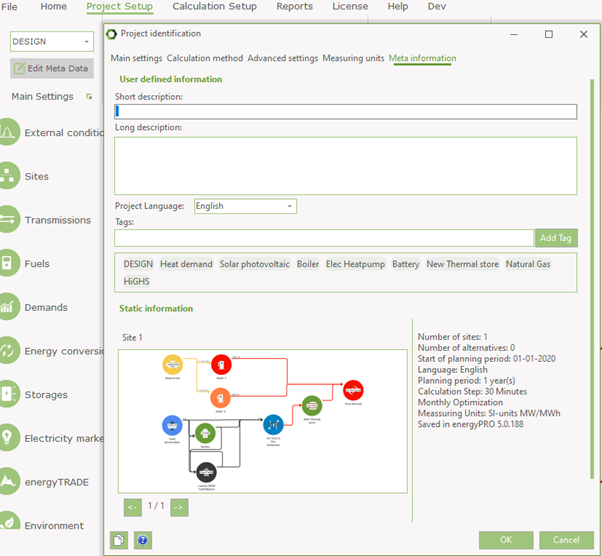
In the Project Setup ribbon, you can edit metadata by opening the Meta Information tab under Project Identification. Here, you can add both short and detailed descriptions, specify the project language, and create custom tags alongside the built-in ones. Additionally, this section provides more detailed project information and includes images of the graphical user interface.
Similarly to viewing metadata for your most recent files, you can now preview project details before loading them.
In addition to the online project examples, we have also made time series data available online.
You can access this by selecting Online Time Series under the External Conditions ribbon.
Background image
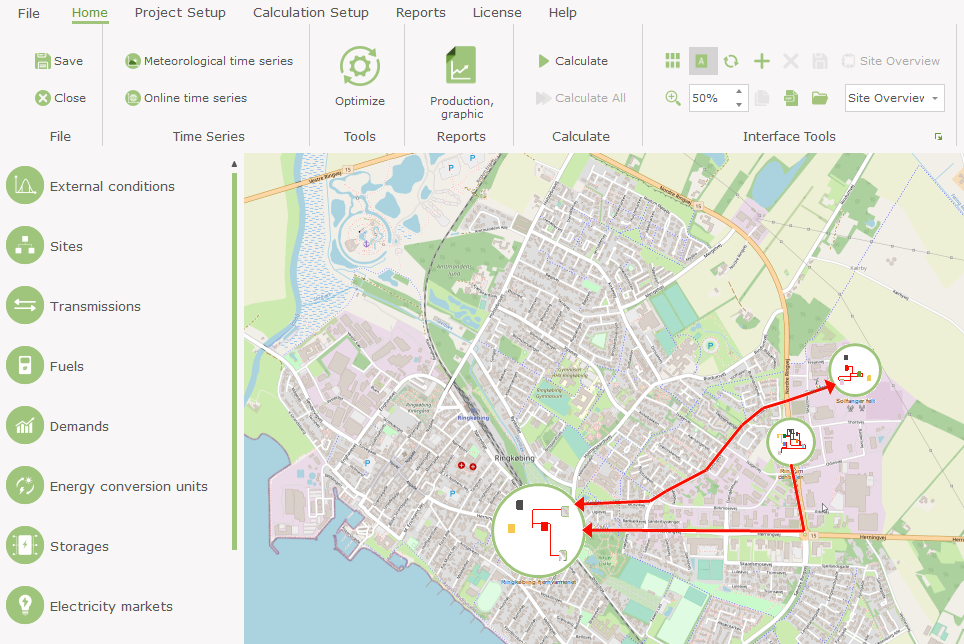
Enhance your graphical interface by adding a background image! Simply right-click within the interface, select Layout, and choose the option to set an image as the background. This is perfect for adding a site overview map or other visual aids to your REGION project.
