EMD Electrical Grid Map and NORA3-ATLAS Update
EMD Electrical Grid Map
The EMD Electrical Grid Map is built upon the OpenStreetMap (OSM) project, with a specific focus on electrical grid data, which are typically hidden in standard map renderings.
The data includes many different types of data, e.g.: grid-lines, substations, wind-turbines, power-plants & transformers.
To highlight this data, we mute the usual map colors and overlay the electrical grid elements. Where available, voltage levels are also displayed alongside the cable lines.
The source data for this map comes from the OpenStreetMap (OSM) project, an open and editable map with global coverage, created and maintained by a dedicated community.
For more information or to contribute to the project, please visit the OpenStreetMap homepage. The EMD Eletrical Grid Map is one of two OSM map renderings in windPRO, with the description of the standard rendering available here.
Samples of two selected places in Denmark and Australia are shown in the figure below.

Samples of EMD Electrical Grid Map in windPRO (left: Part of Aalborg, Denmark, right: Victoria, Australia). © OpenStreetMap contributors.
Legend and Rendering

Legend: EMD Electrical Grid
Power lines are split into 5 categories, each being shown at different zoon levels. The following rules are used in our rendering:
Cables
- Up to 1kV: Shown from zoom level 11 in dark grey
- Up to 35kV: Show from zoom level 11 in light green
- Up to 230kV: Shown from zoom level 5 in light purple
- Up to 500kW: Shown from zoom level 5 in dark purple
- High voltage DC: Shown from zoom level 5 in dark blue
Infrastructure
- Power cables under ground/water is drawn dashed
- Substations are shown from zoom level 8 as a lightning symbol
- Wind Turbine parks are shown from zoom level 8 as a light grey polygon
- Individual turbines are shown a dots from zoom level 8 and as a turbine symbol from zoom level 12
NORA3-ATLAS – Norwegian Reanalysis 2008-2017
The NORA3 dataset is now available in a newly processed atlas version in windPRO.
The atlas data allows users to make pre-feasibility studies using pre-calculated atlas data sources, to easily do a screening of larger areas and to determine which locations are suitable for further analysis and potential development.
The NORA3-ATLAS statistics were calculated by EMD based on 10 years of time-series data provided by the Norwegian Meteorological Institute.
Key features include
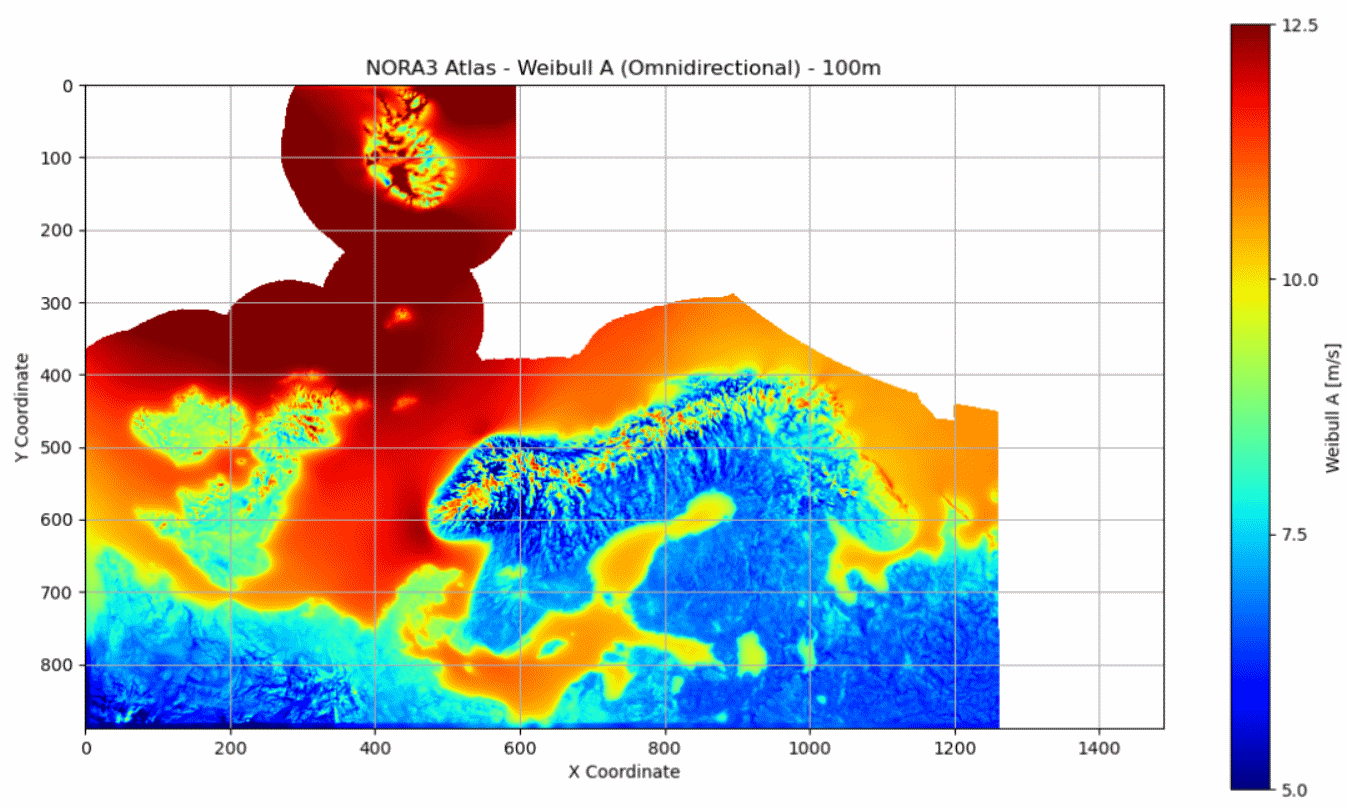
- 3km spatial resolution covering the Baltic Sea, North Sea, Norwegian Sea, and Barents Sea
- Data in the .siteres open-data format
- Seamless integration with windPRO in PARK, Site Compliance, Load Response, and Optimization
- Freely available for all windPRO users
- Atlas (Weibull) statistics based on years 2008-2017 (same period as for EMD-GASP)
- Heights 10m, 20m, 50m, 100m, 250m and 500m
NORA3 uses the HARMONIE-AROME model, offering a valuable alternative for uncertainty modelling and second-opinion analyses. The NORA3 atlas dataset supplements other atlas-datasets in windPRO, including the global EMD-GASP and our EMD-WRF Europe+ mesoscale dataset.
Note: This dataset is suitable for offshore or simple terrain locations. For complex sites, we recommend time-series downscaling with windPRO or using the GASP dataset, followed by validation with local data.
Read more:
– NORA3
– Atlas data (windPRO and EMD-API)
Image: NORA3 Atlas Domain with (Weibull A-parameter in 100m height)

