GLARE *NEW*
-
Calculate glare
Assess if glare will be an issue for neighboring dwellings -
Calendars and maps
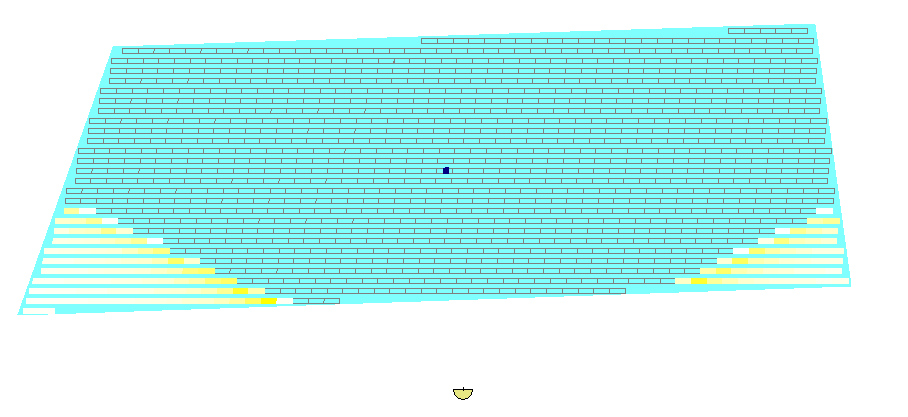
Show which solar panels causes glare and when which receptors receive glare -
Evaluate intensity
Don’t settle for binary results, but calculate how intense the glare will be. -
Multiple types of reflectors
Model the impact of anti-reflective coatings and glass textures -
Generate reports and timeseries
Document the glare effects receptor-by-receptor
Calculate glare
With the ramp up of solar PV construction, more and more people will become neighbors to solar PV units. A common concern amongst neighbors is both about the visual impact on the landscape and about the reflections from the panel surfaces. With the GLARE module it is possible to quantify how much glare a neighbor will receive and when. The GLARE module integrates seamlessly with the SOLAR PV module, making it easy to evaluate the glare from a planned solar PV farm. It is also possible to evaluate the glare of almost any type of building/structure defined as a 3D object.
Calendars and maps
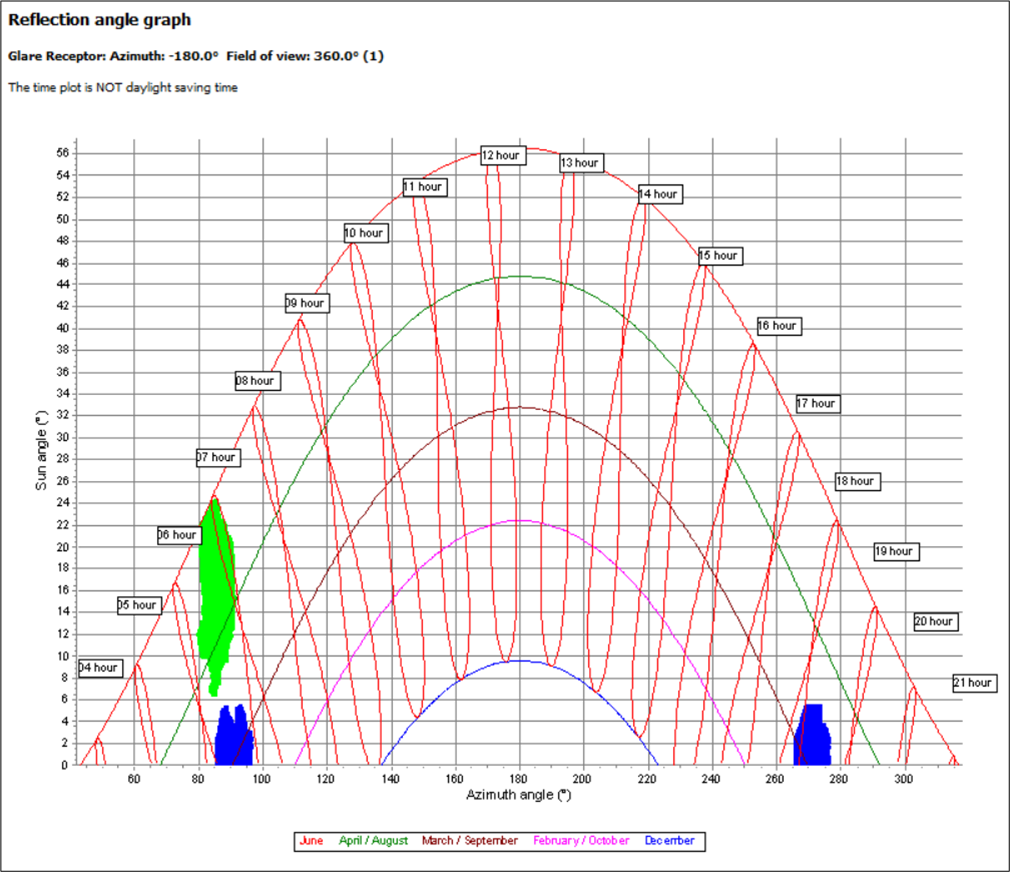
GLARE comes with multiple visual guides to show how glare is occurring as a function of time of day, time of year, azimuth angles, receptor location and reflector location. Using the interactive map, it is easy to view which solar panels cause glare and to adjust the layout to mitigate unwanted glare.
Evaluate intensity
With the GLARE calculation it is possible to include beam spread and intensity calculations. Using this higher-fidelity model it is possible to quantify not just how often glare will occur, but also how strongly it will occur. Some national regulations define glare to be a disturbance if the power density of reflection is greater than 30 W/m2 and the luminance of the reflection is greater than 50.000 cd/m2. Some countries have regulations for glare intensities for airline pilots, while other countries are implementing new glare restrictions in multiple domains. In many cases the GLARE module will assist in evaluating the impact of glare.
Generate reports
Documenting how the impact of glare is as easy as clicking “Print”. The total duration in a year and maximum daily duration of glare is summarized to get a quick overview. Besides showing key figures, the report provides a list of inputs and assumptions used in the calculation along with a with a map with relevant information about receptors and reflectors.
Several timeseries can be generated containing a list of timesteps for which glare can be observed at the receptor. For each timestep this timeseries export includes:
- Time – time of glare, resolution depends on the settings, default – 1min
- Glare table count
- Incidence angle
- Sun azimuth
- Sun altitude
- Reflected irradiance


